The Right Data At The Right Time.

Right now, we don’t see data in the right way to know for sure what’s going on in real time. Sure, I can see something is wrong, but that next step to what specifically is the problem is a leap right now, and getting to what needs to be done to fix it, isn’t always clear."
"Improving supply chain management (I.e., identifying opportunities to reduce waste, increase standardization, and optimize preference cards), requires exploration and customization—beyond standardized reports."


"When hospitals embark on supply chain improvement initiatives, it’s critical to monitor and measure the impact. This is extremely difficult if users can’t create detailed and targeted reports."
"With multiple users involved in supply chain management, users’ reporting and analytics needs vary greatly. When users can’t easily create and share tailored reports, inefficiencies arise."

"Navigating between the reporting portion of the platform to the action-oriented functionality is a complex, multi-step process. Users can’t quickly view a report and then take action."
Configurable reporting

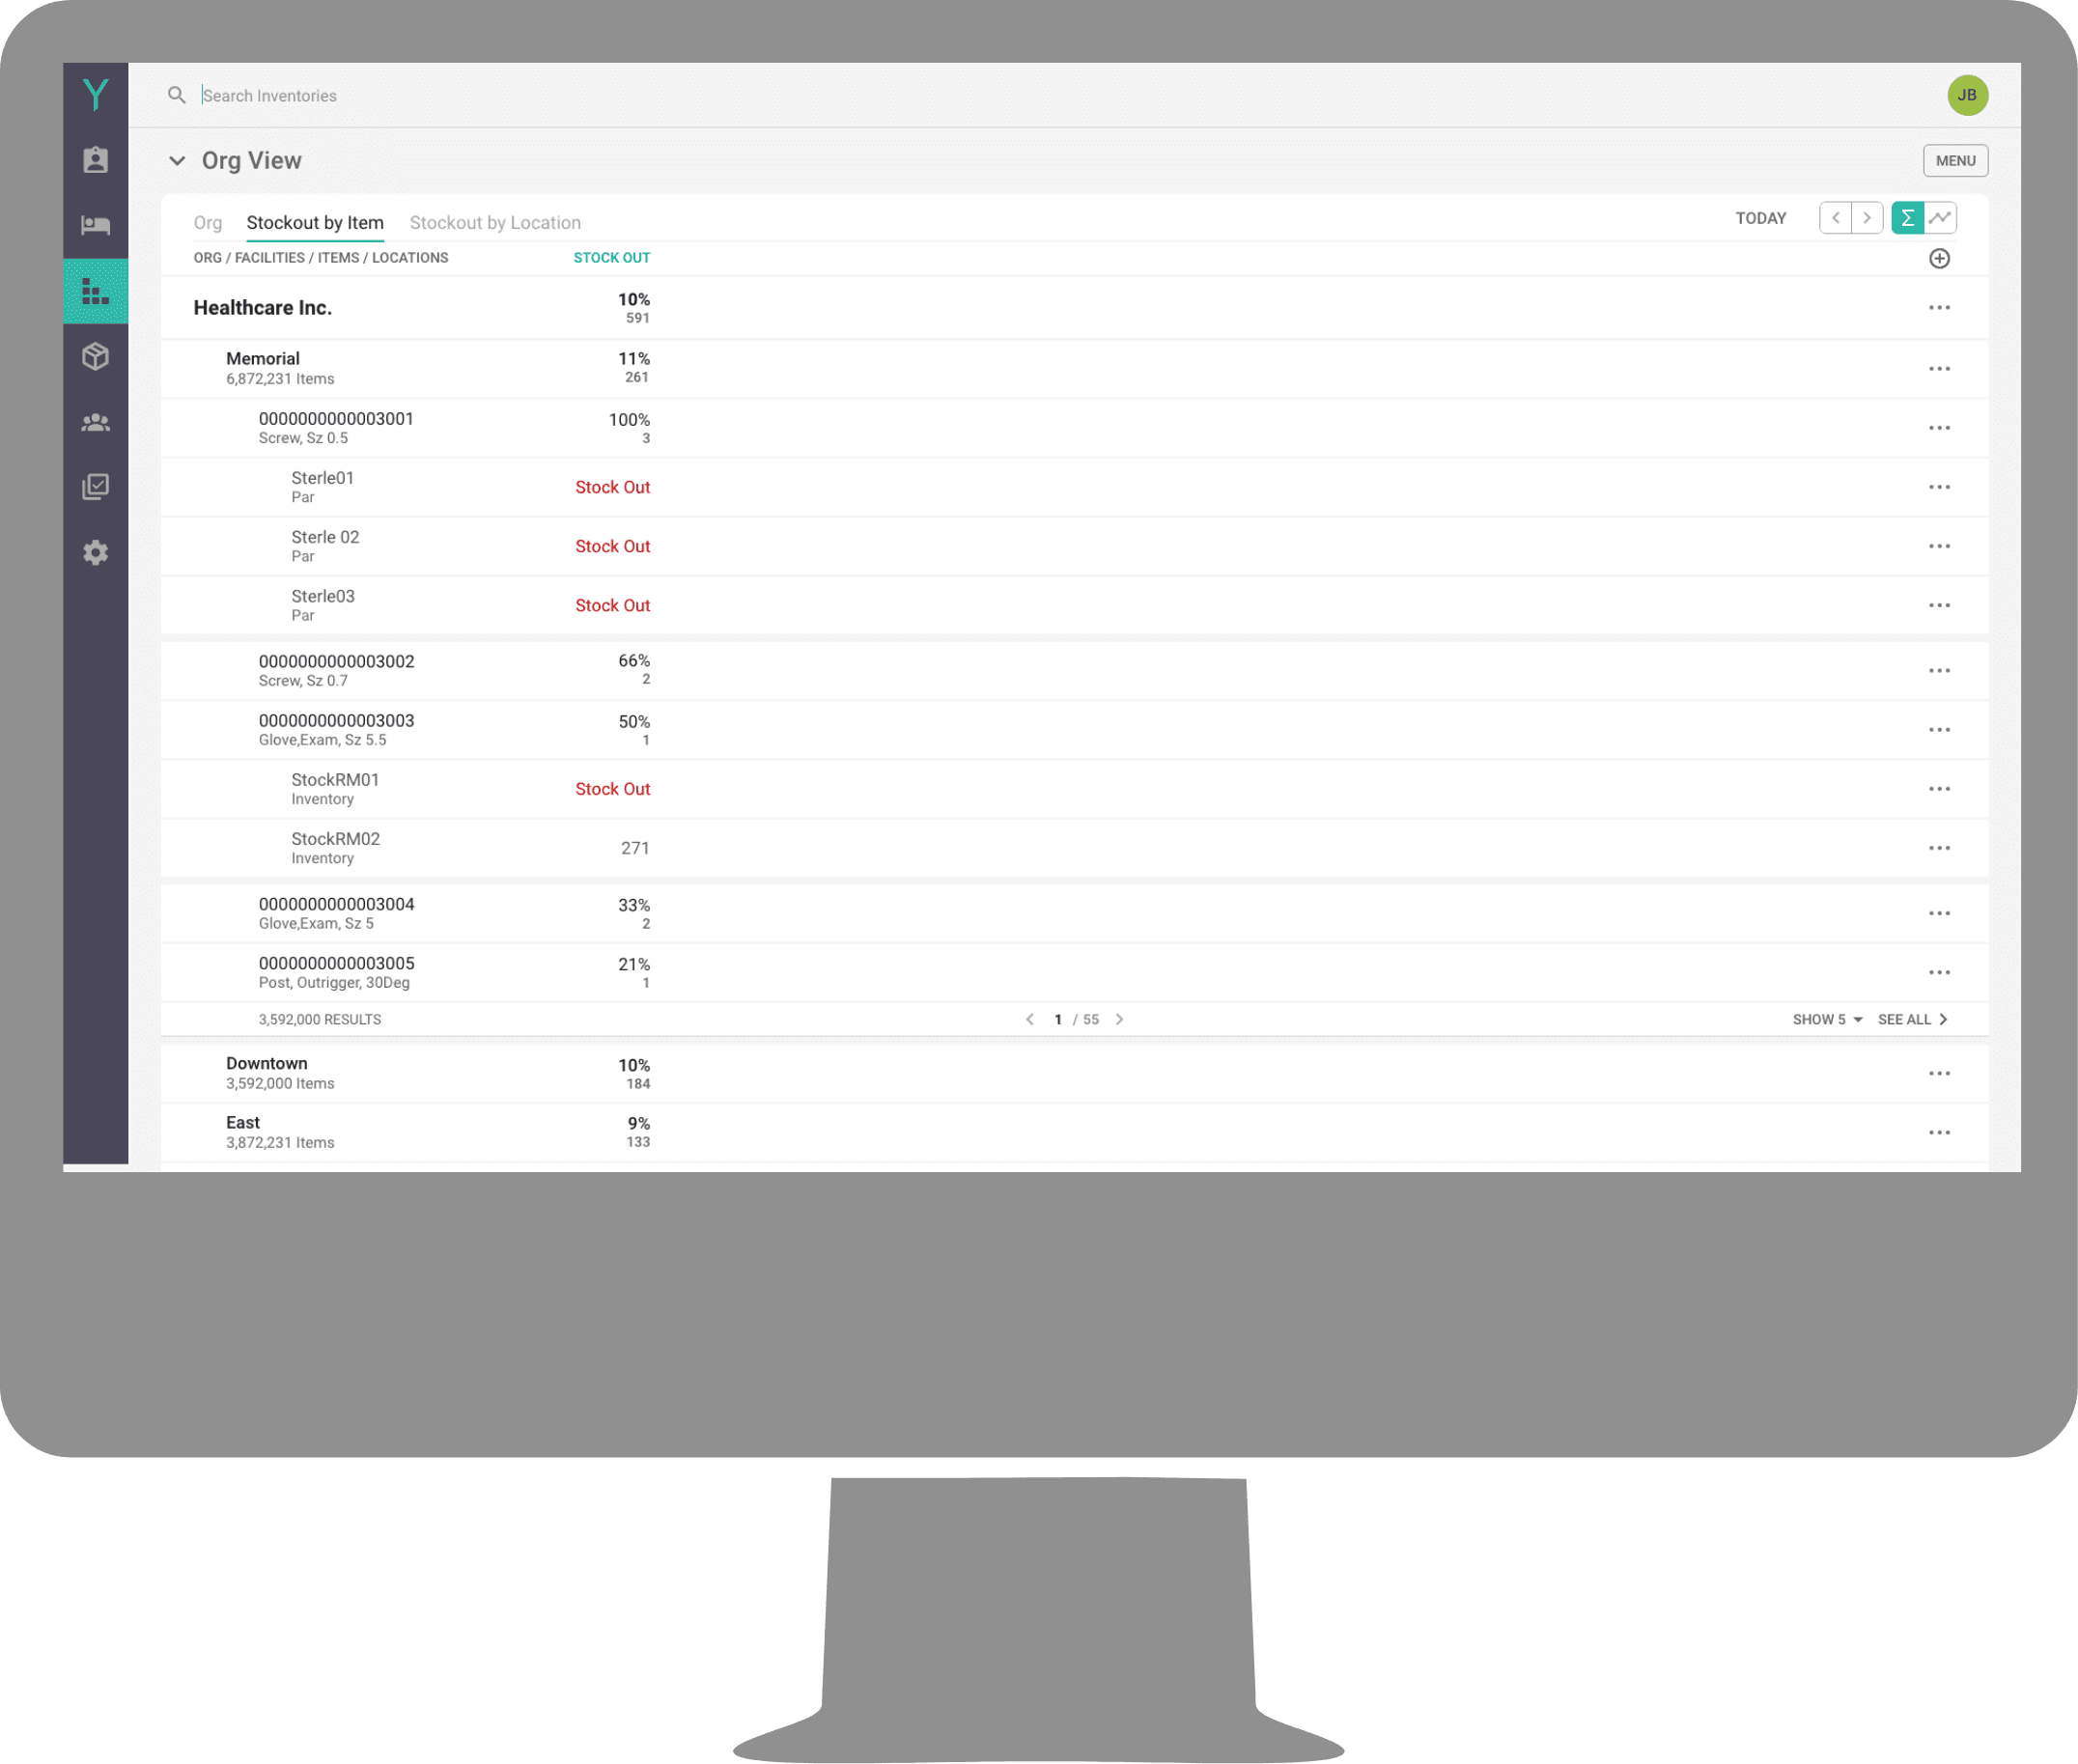
We are looking into ways to surface KPIs into a customizable dashboard. This allows users to surveil — in real time — efficiencies and operations and identify problems as they are occurring.
We are actively testing a customizable reporting solution that allows users to visualize and modify reports, add or remove data elements, metrics, and filters, and organize and structure information as a situation warrants. We aim to provide a central hub that aggregates data across systems and offers complete, real-time information with flexible, customized reporting capability.
We are looking into ways to surface KPIs into a customizable dashboard allowing users to real time surveillance of efficiency and operations. That answers question about the current situation as well as track initiatives
Actively testing a customizable reporting solution with charts and tables. Users will be able to add and remove data elements, metrics, filters as needed in this simple to use but powerful data tool. Testing with Advanced and users new to data oriented tracking generating a design that first both types of users needs. When users make something that is really useful they can save it, share it, and even promote specific metrics up to key dashboards.
Future of Supply Chain Management

Descriptive Analytics
Aggregates and synthesizes data source
Displays data in configurable and visual dashboards and reports
Correlates data to operational performance metrics

Diagnostic Analytics
Performs surveillance on data
Diagnoses problems
Presents user with causal analysis

Predictive Analytics
Correlates historical patterns to predict future performance outcomes
Notifies users when events that need preparation and planning are about to occur

Prescriptive Analytics
Calculates and recommends highest impact solution to improve key performance metrics
Guides users to gold standard performance and process KPIs

Cognitive Analytics
Leverages machine learning to fully automate supply chain management and for real-time performance optimization
Join us!

